Dashboard: Audiences
ContactPigeon's Audiences Dashboard is a comprehensive tool that provides detailed insights into the client's total audience and segmented lists. It helps you gain valuable information regarding user acquisition, contact growth, and commercial performance.
Overview KPIs

Τwo informative scorecards displaying the client's customer base growth over the selected time period and the total number of acquired contacts. These KPIs offer a quick snapshot of audience development.
Contact Trends
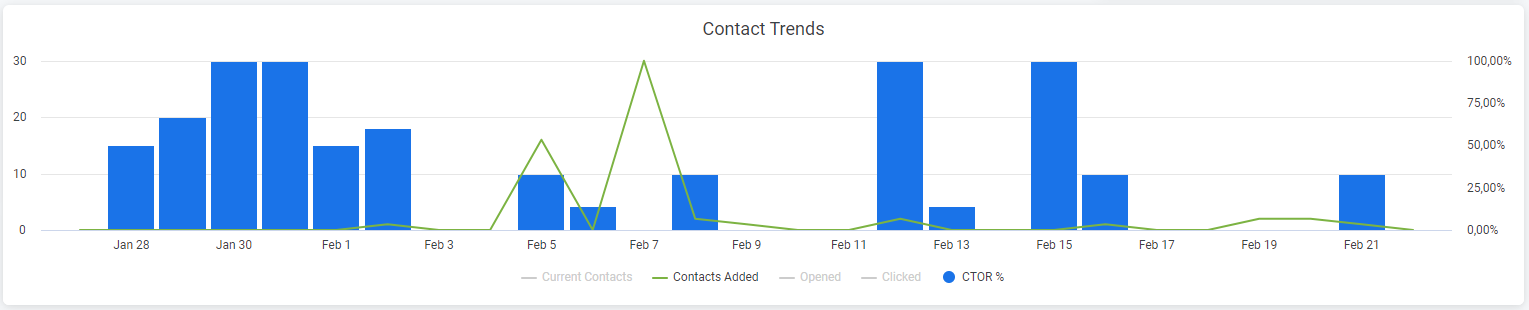
This graph displays the growth of the day-by-day customer base alongside selected marketing metrics such as Opens, Clicks, and CTOR. This visualization provides a dynamic view of audience engagement over time.
List Performance for the Last 30 Days

Peruse a table visualization presenting active and inactive segments (lists) with a performance evaluation regarding contact size and revenue generated. Note that performance figures are specific to the last 30 days and are not linked to date range filters.
- Segment Drill Down: Each segment is clickable, directing you to a detailed dashboard, which is explained within the list drill down.
- Contacts Column: Indicates the total number of subscribed/acquired users within a specific segment.
- Web History Column: This column highlights the number of users in the same segment who have interacted with the website/eShop in the last 30 days.