Dashboard: Automated Campaigns
This dashboard corresponds with Ad Hoc Campaigns and consolidates all commercial and marketing Key Performance Indicators (KPIs) for automated campaigns, irrespective of the communication channel. The dashboard comprises various sections, with an overview of all campaigns at the top, presenting performance data in an aggregated format.
Note: All sections, except for Campaign Details, are linked to date range filters. Campaign Details display aggregated statistics since the beginning of each automated campaign.
Overview KPIs
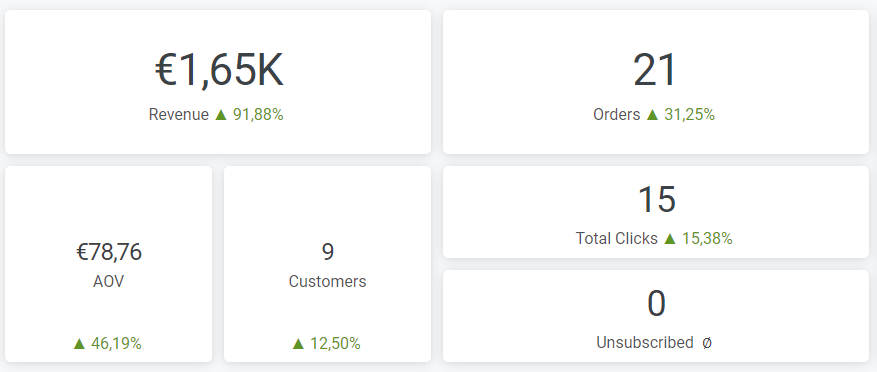
Selected KPIs for all campaigns sent and delivered during the chosen period:
- Revenue: Total revenue generated in the selected time range.
- Orders: Number of orders during the same period.
- AOV (Average Order Value): Average Order Value for the selected period.
- Customers: Number of unique customers making at least one purchase during the selected time range.
- Total Clicks: Total clicks across all campaigns during the selected time range.
- Unsubscribed: All unsubscriptions during the selected period.
Orders by Channel
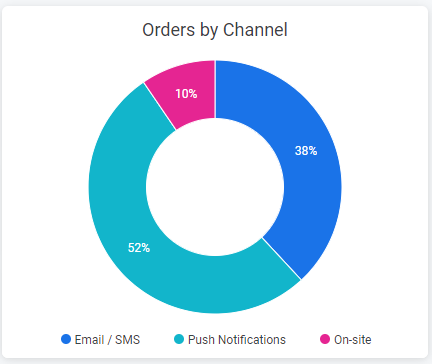
Graph depicting the distribution of total orders by communication channel.
Revenue by Channel
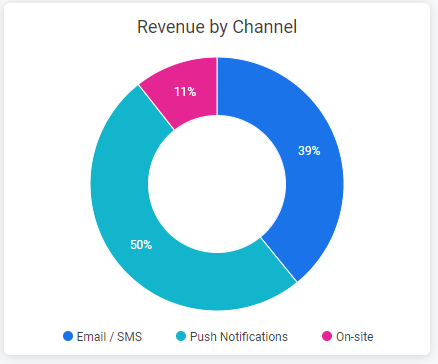
Graph illustrating the distribution of total revenue generated by the communication channel.
Conversion Funnel - Email/Mobile/Postcards
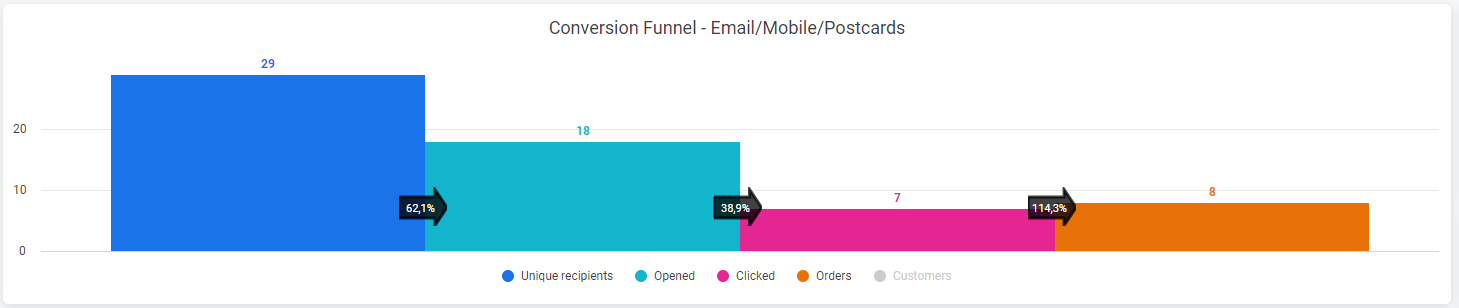
Interactive visualization showcasing the adjusted funnel for Email, Mobile, and Postcard channels. Two "final" steps, Orders and Customers, represent different conversion success metrics.
Daily Performance - Email/Mobile/Postcards
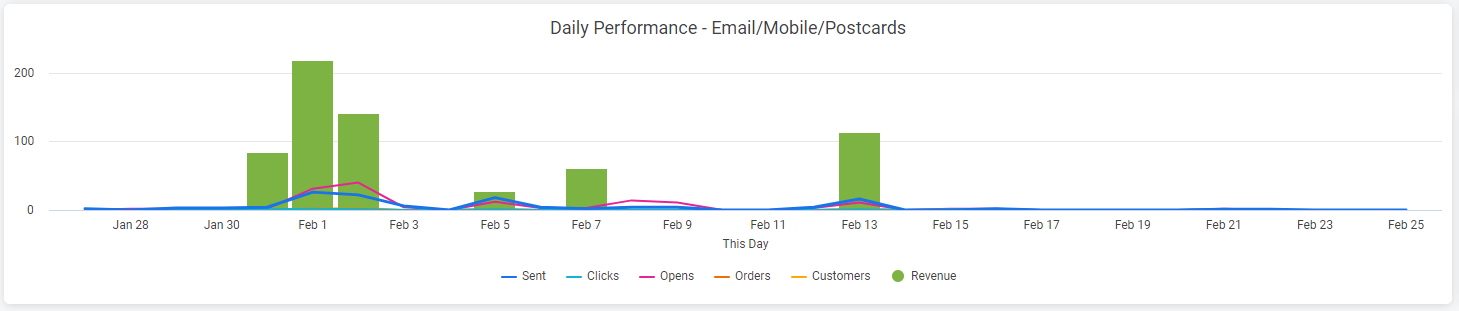
The date-based graph displays all campaigns' daily performance using specific marketing and commercial metrics. It is fully interactive for varied KPI analyses.
KPIs - Email/Mobile/Postcards

Series of marketing metrics demonstrating basic measurements (Number of sent campaigns, total campaign opens, and total campaign clicks) for the selected period.
Conversion Funnel - Push Notifications
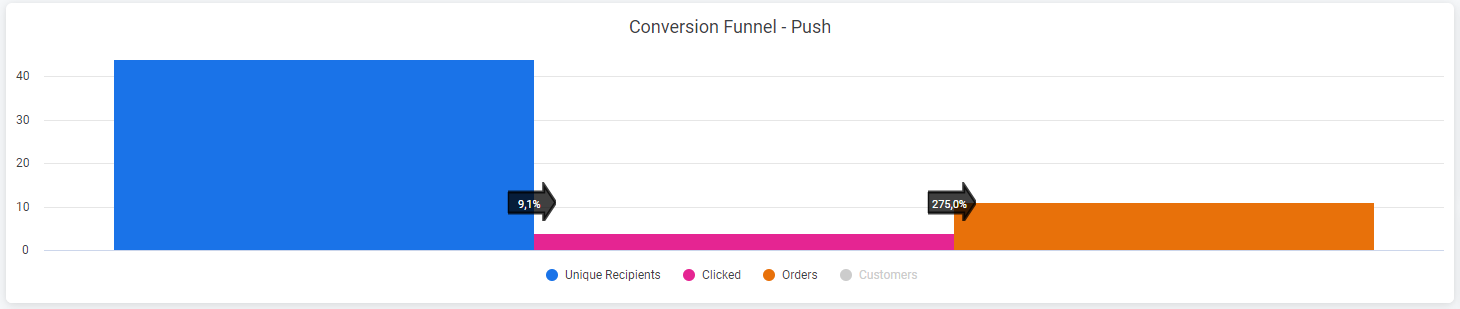
Graph illustrating the conversion funnel steps for push notifications channels. Fully interactive for custom analyses.
Daily Performance - Push Notifications
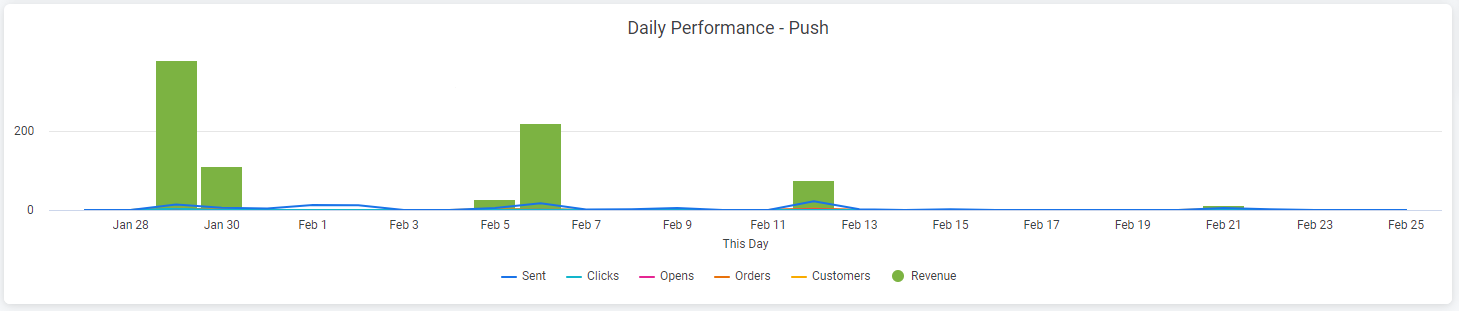
Date-based graph showing the daily performance of campaigns for push notifications. Fully interactive for diverse KPI analyses.
Other KPIs - Push Notifications
Series of marketing metrics demonstrating basic measurements (Number of sent messages and total message clicks) for the selected period. Note: Opens are not tracked for web push notifications.
Conversion Funnel - On-Site Pop-Ups
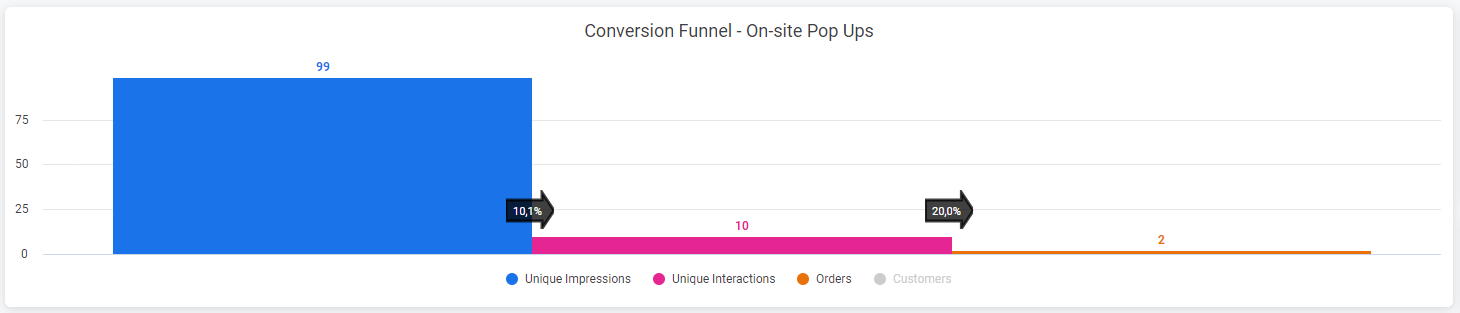
This visualization illustrates the conversion funnel based on the On-Site channel (pop-ups). It is interactive for in-depth analysis from impression to sales conversion.
Daily Performance - On-Site Pop-Ups
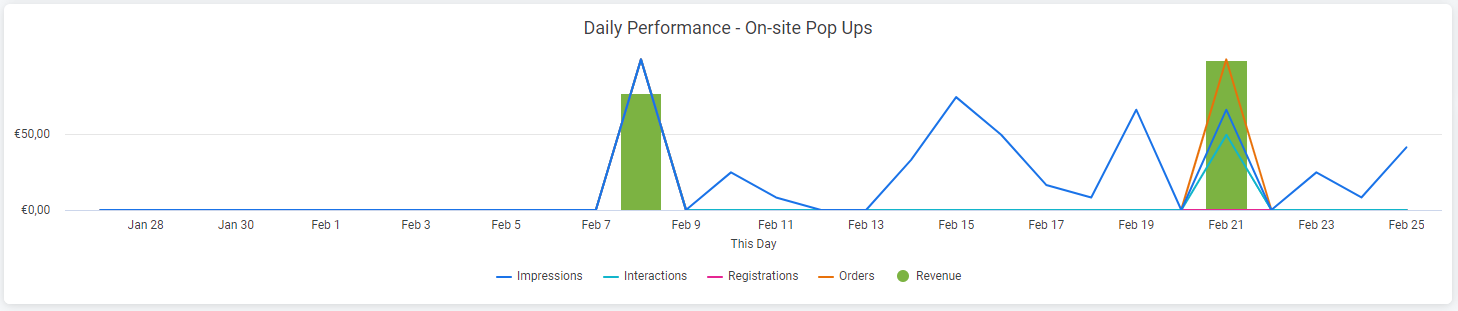
This date-based graph shows the daily performance of on-site pop-up campaigns. Fully interactive for diverse KPI analyses.
KPIs - On-Site Pop-Ups

On-Site marketing campaign metrics showcasing overall channel performance. A different set of KPIs compared to other channels:
- Total Impressions: Total views of pop-up campaigns during the given period.
- Total Interactions: Total actions (clicks or email subscriptions) after seeing pop-up campaigns.
- Registrations: Total registrations (subscriptions) generated by pop-up campaigns.
Active Email/Mobile/Push/Postcards Campaigns
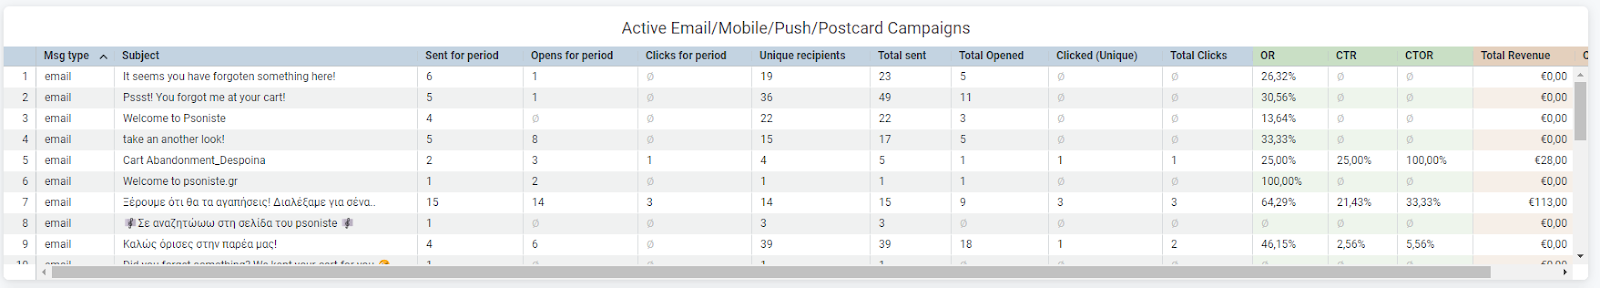
Table listing every active automated campaign for all channels except On-Site. Detailed performance analysis, from specific marketing metrics like opens and clicks to commercial metrics such as revenue and orders.
Note: Commercial KPIs (Orders and Revenue) in this table are not linked to time range selection.
Running Pop-Up/Onsite Campaigns
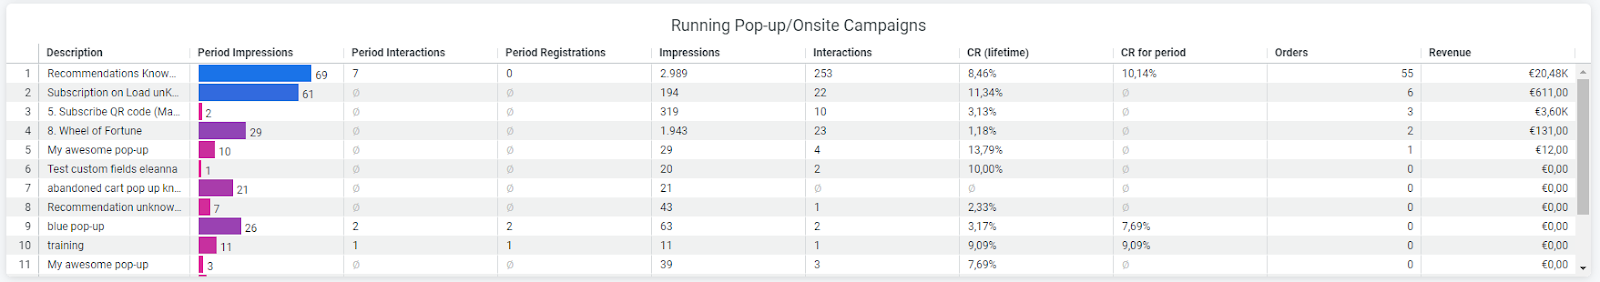
The second table illustrates the holistic performance of all On-Site campaigns. Marketing-related KPIs are shown both for the selected time range and in totals, and commercial metrics (orders and revenue) are presented in totals.
You can use these refined descriptions for an enhanced and consistent understanding of the Automated Campaigns Dashboard.