Dashboard: Ad Hoc Campaigns
This dashboard provides insights into the commercial and marketing performance metrics of all mass campaigns sent via ContactPigeon, irrespective of the communication channel (Email, Push Notification, SMS/Viber, etc.).
Overview KPIs

Selected key performance indicators for all campaigns sent and delivered during the chosen period:
- New Campaigns: All new campaigns sent (across channels) in the selected timeframe.
- Total Msgs: The total number of messages delivered.
- Total Clicks: The overall number of clicks (non-unique) tracked during the period.
- Total Orders: The total number of orders placed in the selected period.
- Revenue: Total revenue generated during the chosen period.
- User CR: The conversion rate is based on user data, offering a more accurate evaluation by considering personalized, unique interactions.
- CR: Conversion Rate based on total interactions (clicks), derived from other platforms and considered less accurate.
Average Campaign Metrics
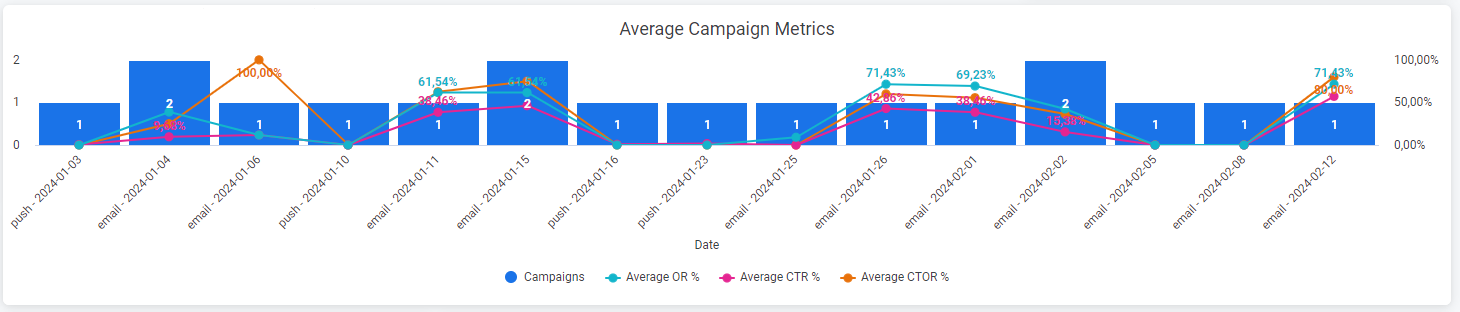
A combined graph chart showcasing specific KPIs (Number of Campaigns, Average Open Rate, Average Click-Through Rate, and Average Click-To-Open Rate) in chronological order based on the campaign date.
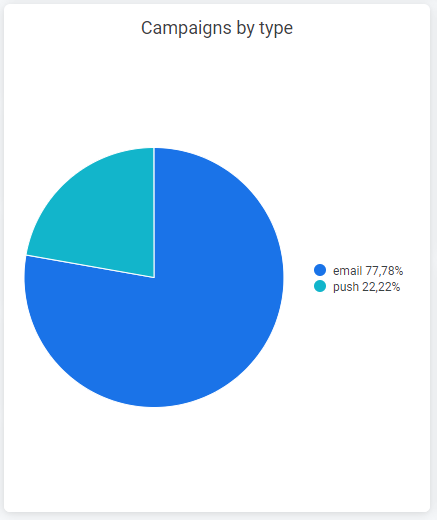
Campaigns by Type
Distribution of campaigns across different communication channels during the selected period.
Revenue Contribution by Type
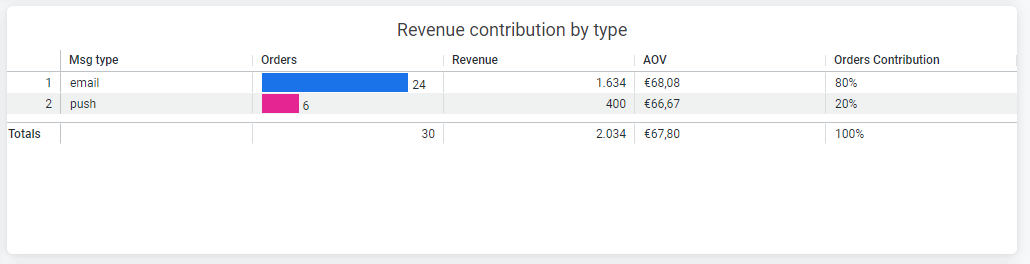
This chart shows the attribution across the communication channels among three key metrics: Revenue, Average Order Value, and Orders for the chosen time period.
Average Message Performance by Type
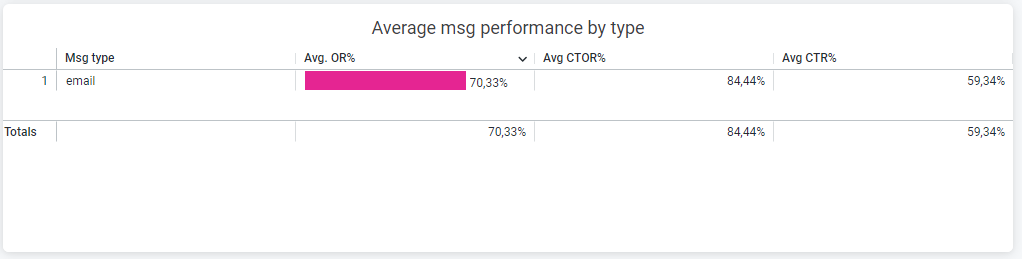
A table displaying three selected KPIs (on average) for all communication channels applicable to this performance measurement (OR, CTOR, CTR).
Email KPIs

This section includes various KPIs for the Email communication channel:
- Sent: Total recipients for messages sent during the selected period.
- User Open Rate: Open Rate metric for all messages sent, providing a more accurate evaluation.
- User CTR: Click-through rate on a user level, offering more accuracy.
- User CTOR: Click-to-Open Rate based on user interactions.
- User CR: Conversion Rate based on unique users.
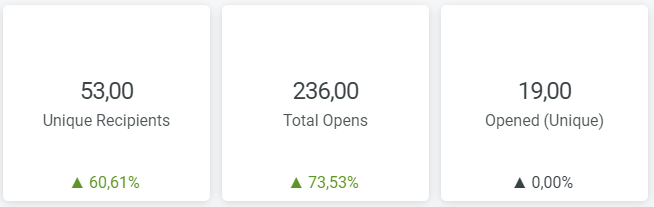
- Unique Recipients: The total number of unique recipients of email messages.
- Total Opens: Total number of email campaign opens.
- Opened (Unique): Number of unique clicks made by recipients.
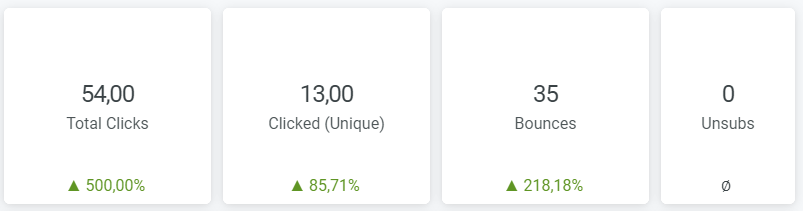
- Total Clicks: Total click interactions.
- Clicked (Unique): Number of unique click interactions.
- Bounces: Total email bounces (soft and hard).
- Unsubs: Total number of unsubscriptions.
Email Funnel
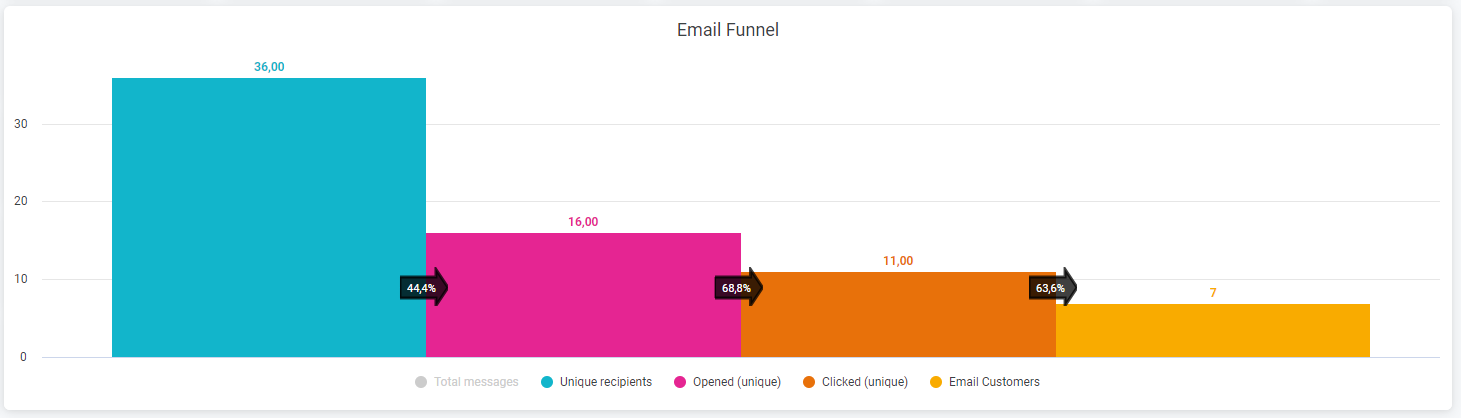
This visualization illustrates the funnel process for the Email channel, allowing clients to interact and explore the entire process up to conversion (Email Customers).
Push Notifications KPIs
Metrics related to Push Notifications.
Mobile Messaging (SMS / Viber) KPIs
Metrics for Mobile Messaging (SMS / Viber).
Postcards / 2-Way QR
Metrics related to Postcards and 2-Way QR.
Campaigns - Full List
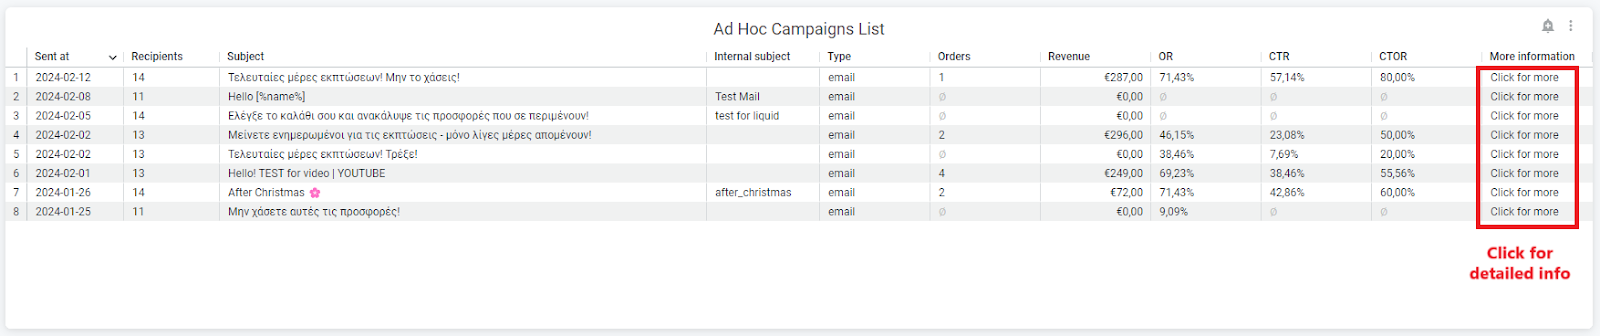
This table evaluates each campaign sent during the selected time ranges across all marketing channels, with relevant KPIs. It provides the option to drill down for more detailed information.
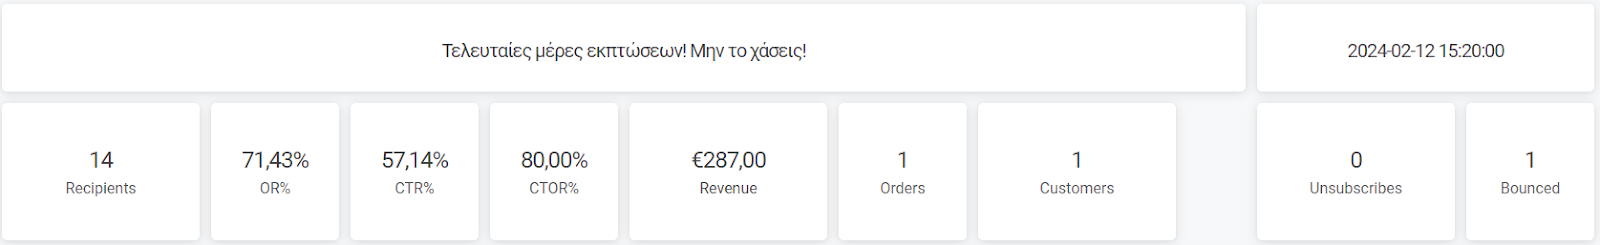
Campaign - Drill Down
Upon clicking a campaign for a drilled-down view, the CDP redirects to a page with detailed information and performance metrics. This includes:
- Overview of the campaign, including Campaign Name and Date/Hour of sending.
- Prominent KPIs used for evaluation.
- Adjusted funnel is specific to the email campaign.
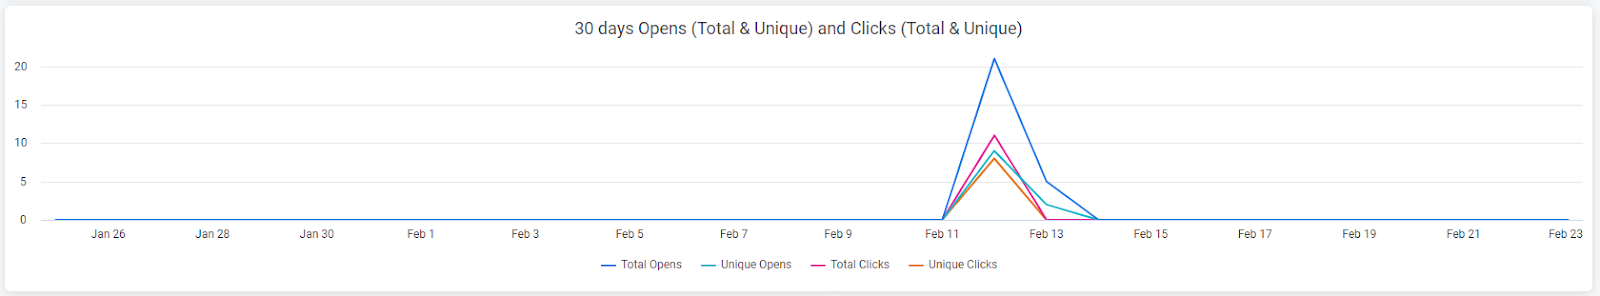
- Time-based graph showing the last 30 days' interactions.
- Graph illustrating unsubscriptions.

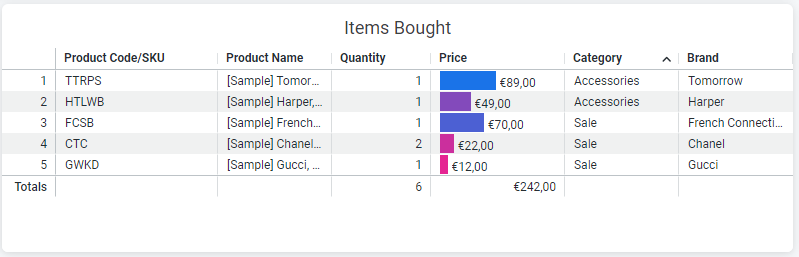
- Detailed information about products sold in the campaign, including SKU, category, brand, quantity, and price.